Exhibition — 2026
New York Transit Museum: Sonification Division
An interactive installation at the New York Transit Museum, using capacitive touch sensors to map the subway system in each borough to a tone pitched to its ridership.
What I Did
Part of The Tridimensional Institute for Transportation Research, Analysis, and Discourse: Cartography Division, a group exhibition at the New York Transit Museum, Brooklyn, NY (2026).
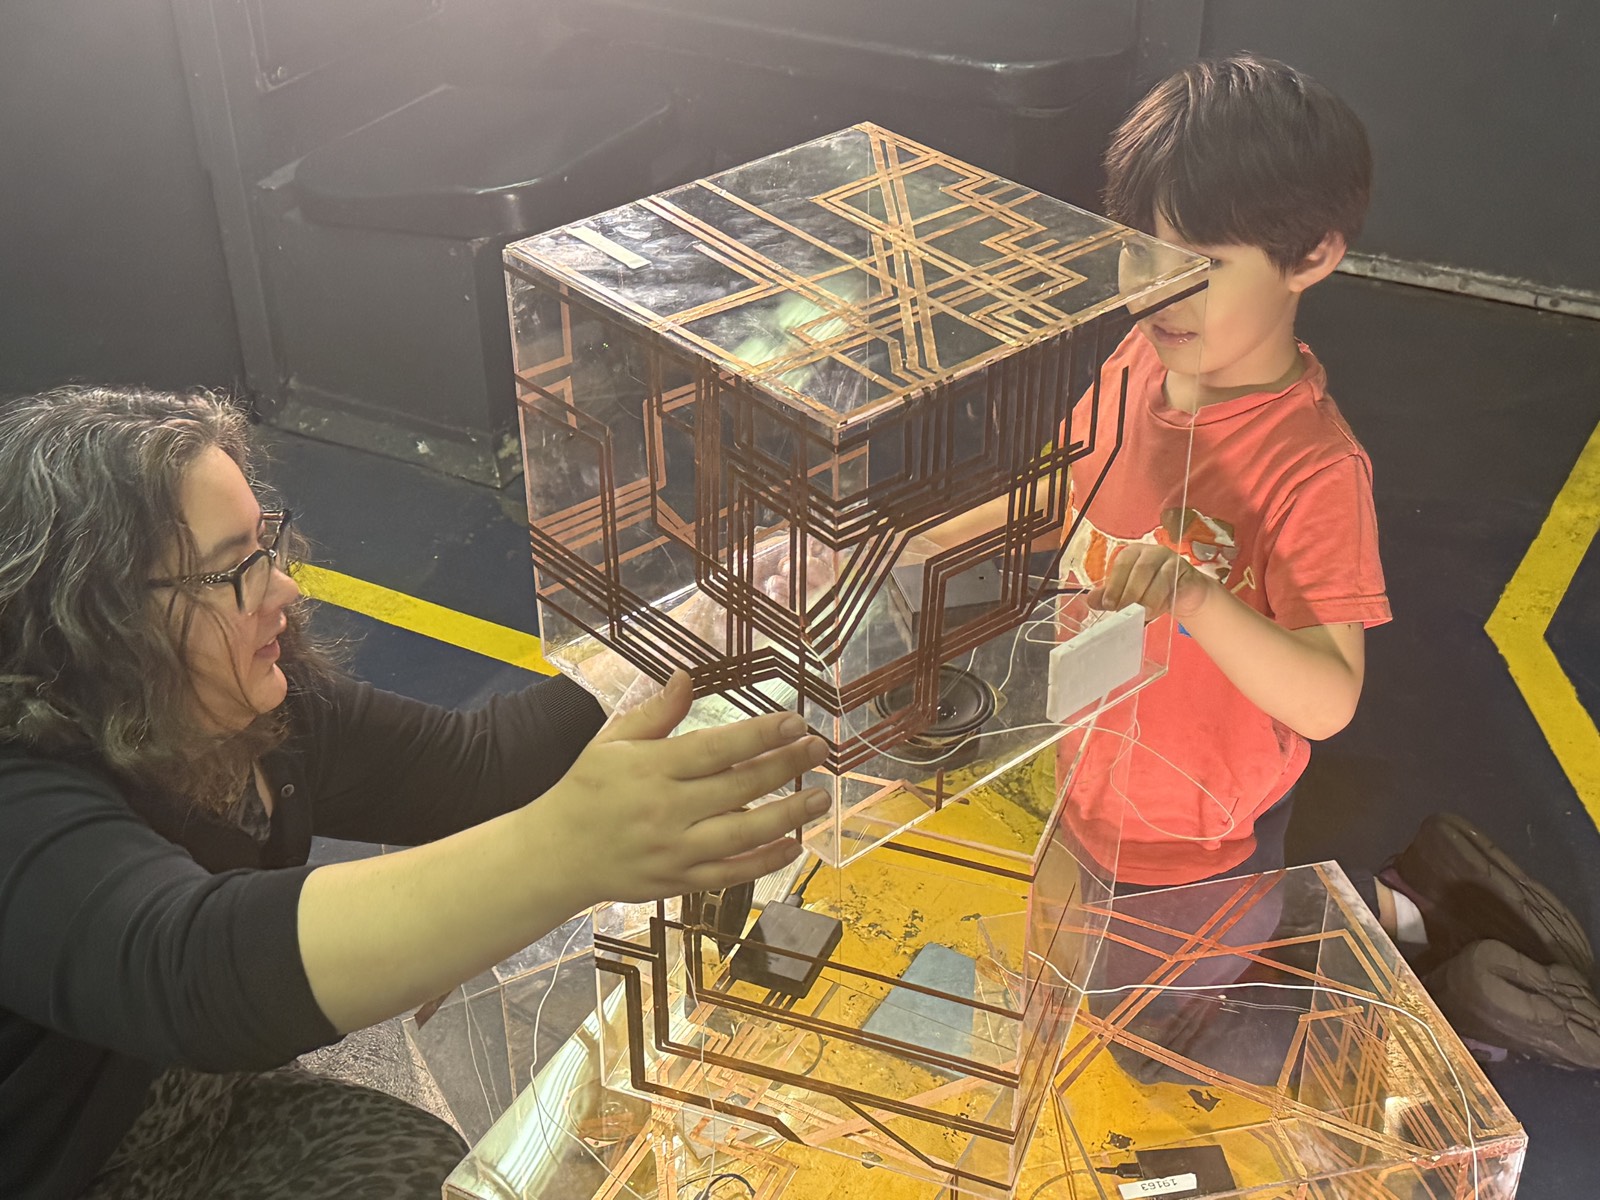
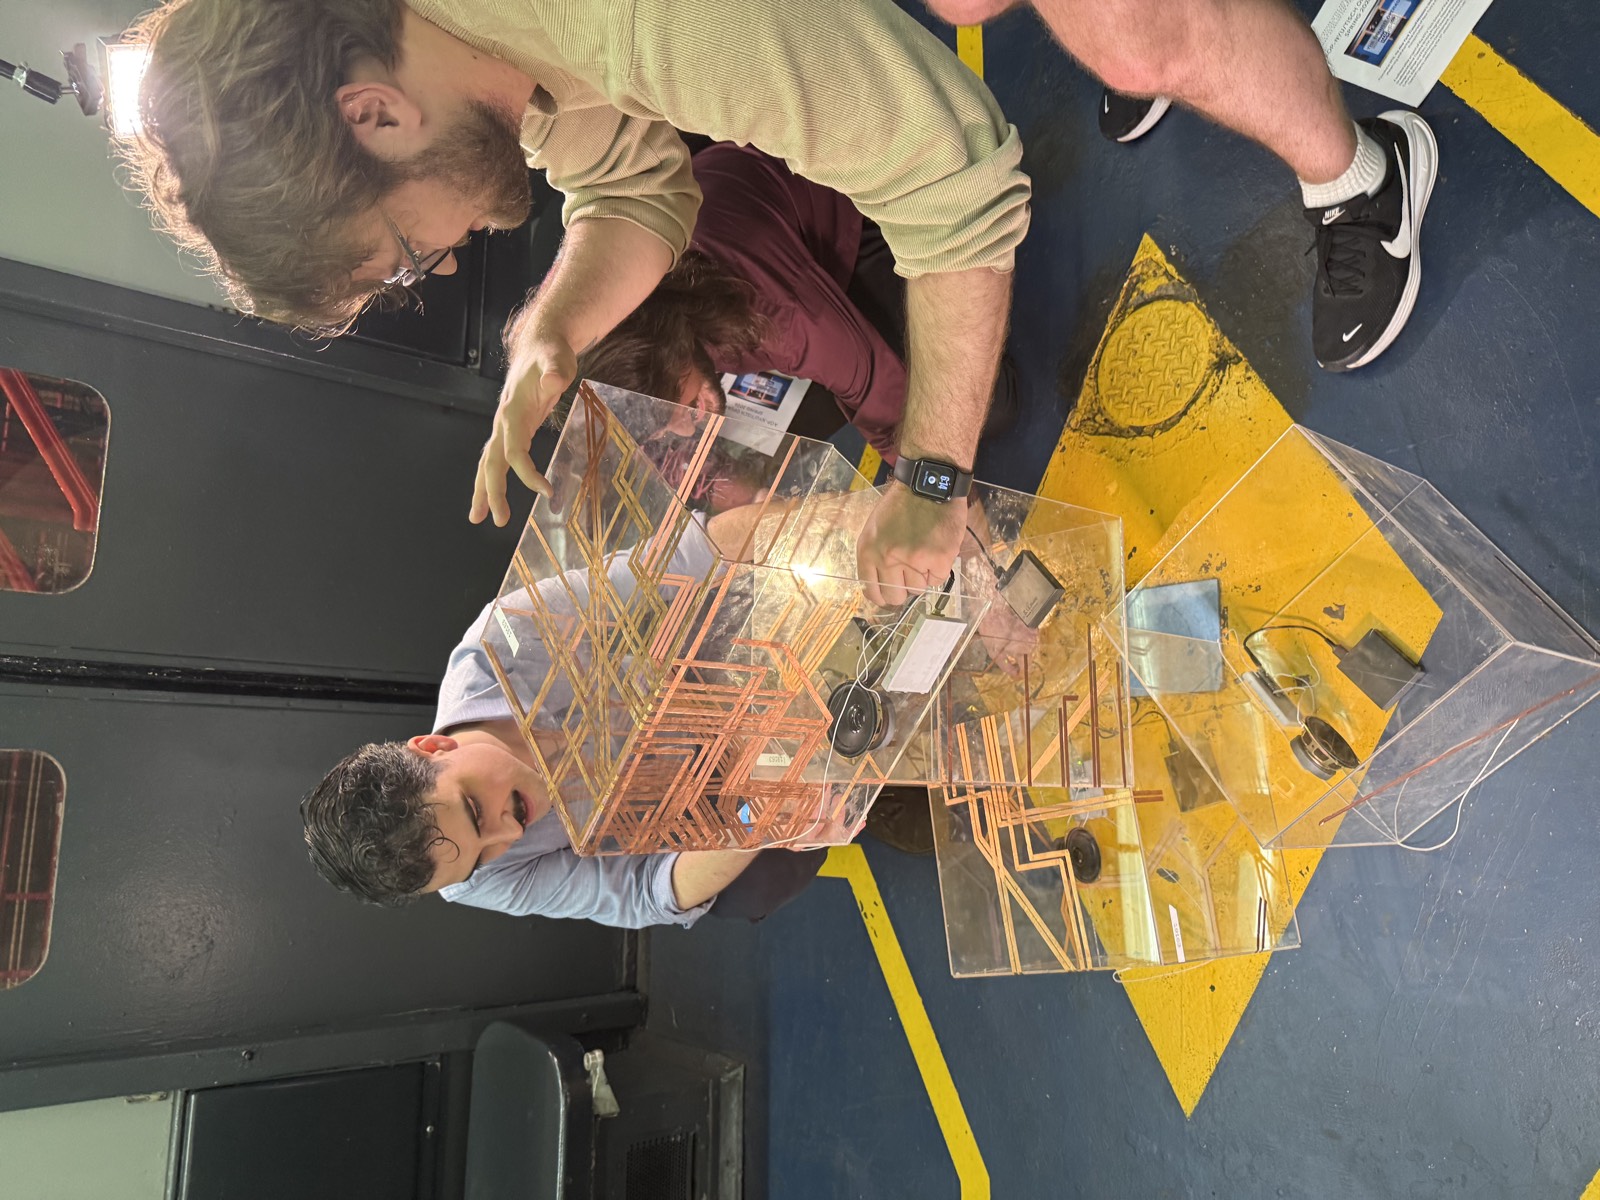
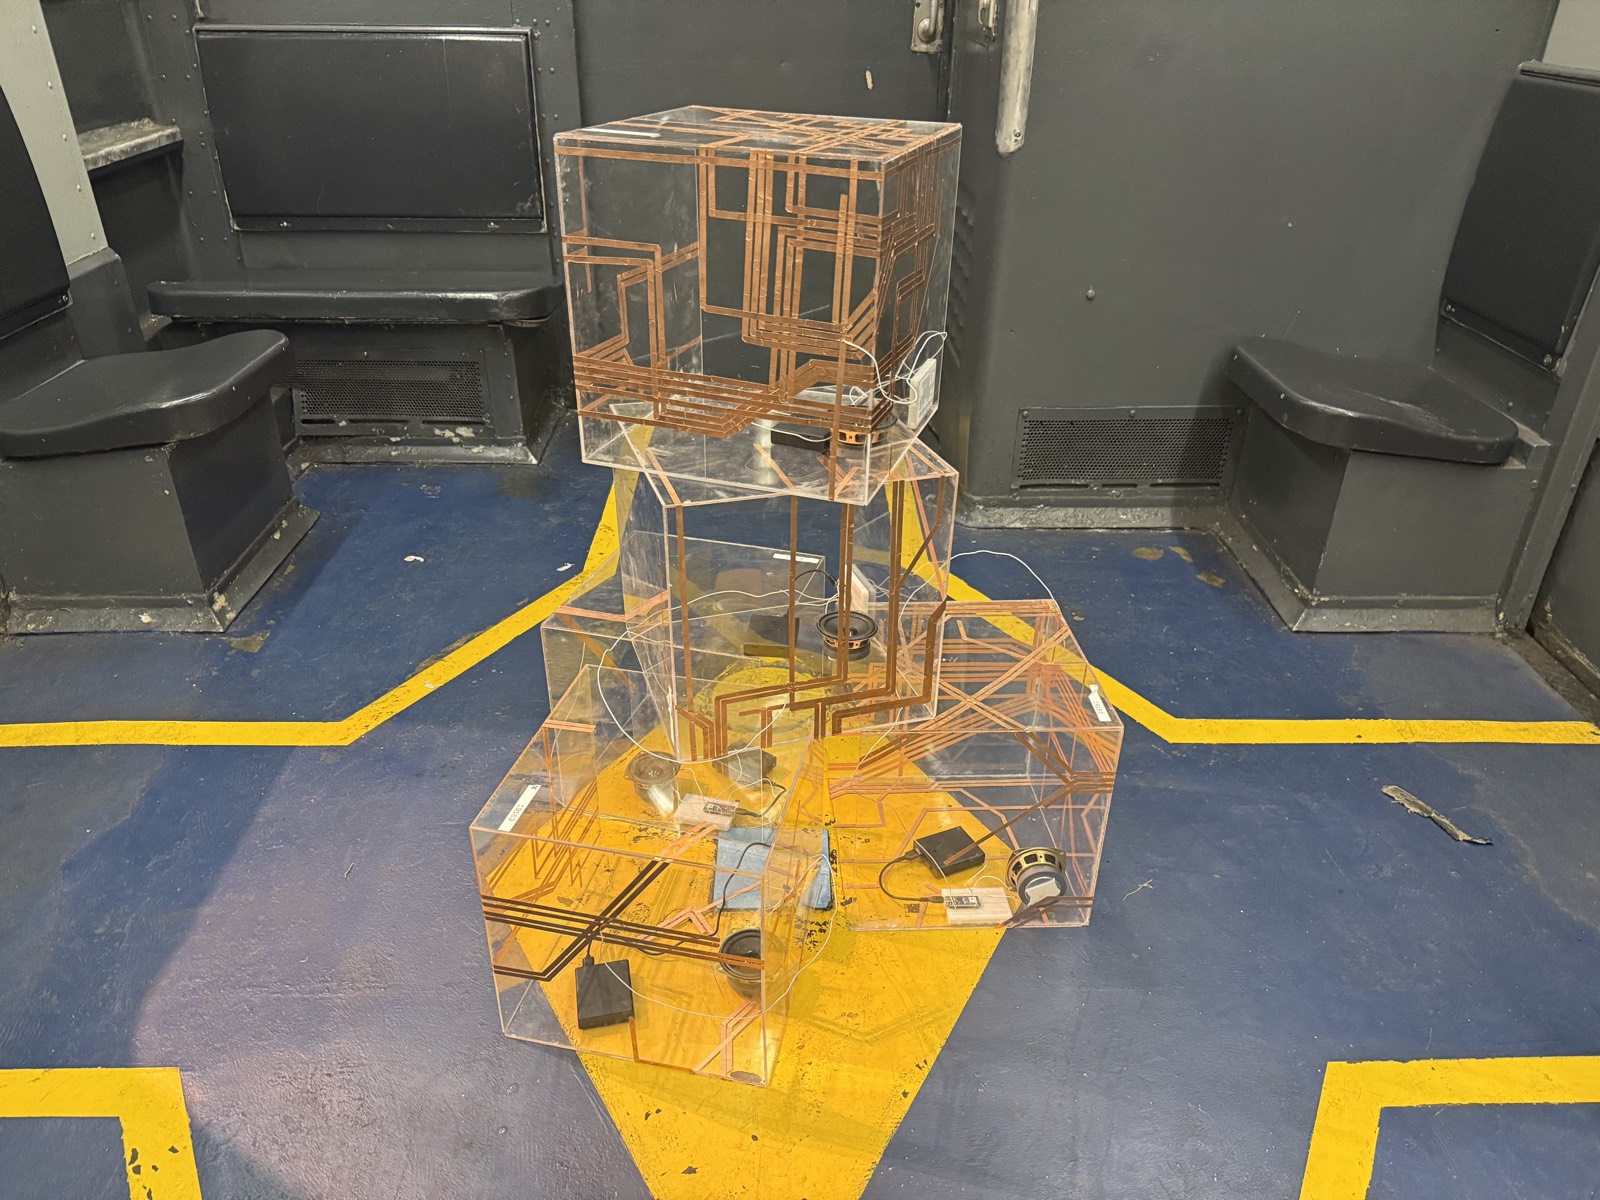
The piece used capacitive touch sensors, made with copper adhesive, to build cubic maps of the subway system in each borough. Every borough's cube emitted a tone, and the pitch of that tone mapped to the average level of ridership there. Manhattan sat highest, since it tends to have the most people moving through its underground at any given moment; Staten Island sat lowest, since the SIR tends to carry the least.
The sensors respond to skin contact, so touching the cubes is how they are played. Visitors could make music on the subway map and compose songs together.